A chart’s capacity to convey information is mostly wasted. The untapped opportunity lies beyond the simple rectangles of a bar chart. We can find it in the other pieces of the graphic that help you see what those rectangles have to say.
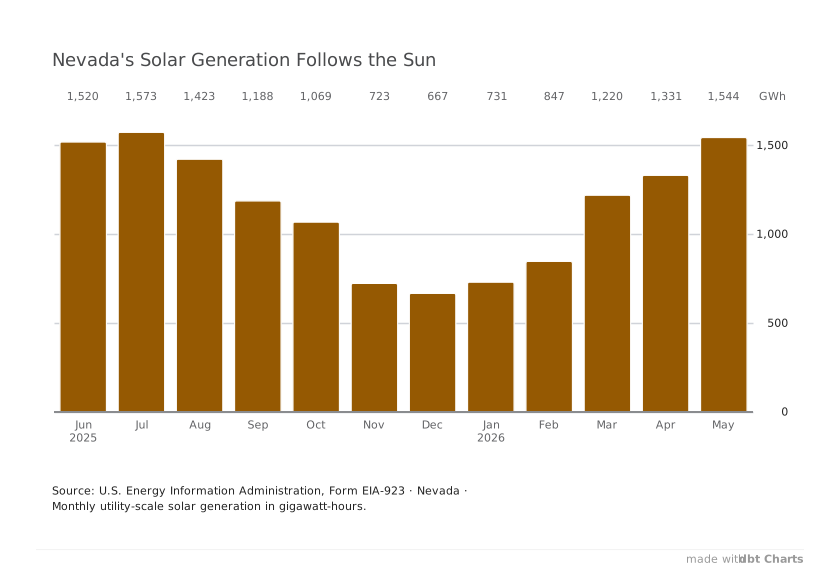
Look at a good newspaper chart, a graph in an annual report, or a century-old diagram. Their care extends beyond their marks. Typography reinforces the statistical plot. Color draws the eyes to where they need to go. Gridlines and axis labels are there for when they are needed without getting in your way. Today’s finer chart examples still accomplish much of this work by hand, chart by chart.
We built dbt Charts in a way that makes careful design consideration routine. Every part of the chart should have a reason to look the way it does, and those reasons must agree and combine for a more engaging and effective composition. dbt Charts renders dashboards from YAML, and that process is rich with intention.
Take electricity for example.
In Nevada, renewable sources rose from 11% to 44% of the electricity generated within the state between 2001 and 2025. The layered bars show that leap alongside the rest of the Mountain West: narrow dark-green bars for 2025, set against broad pale-green bars for 2001. These are shares of each state’s own generation, not of what its people consume: Idaho, at the top, imports about a quarter of the electricity it uses.
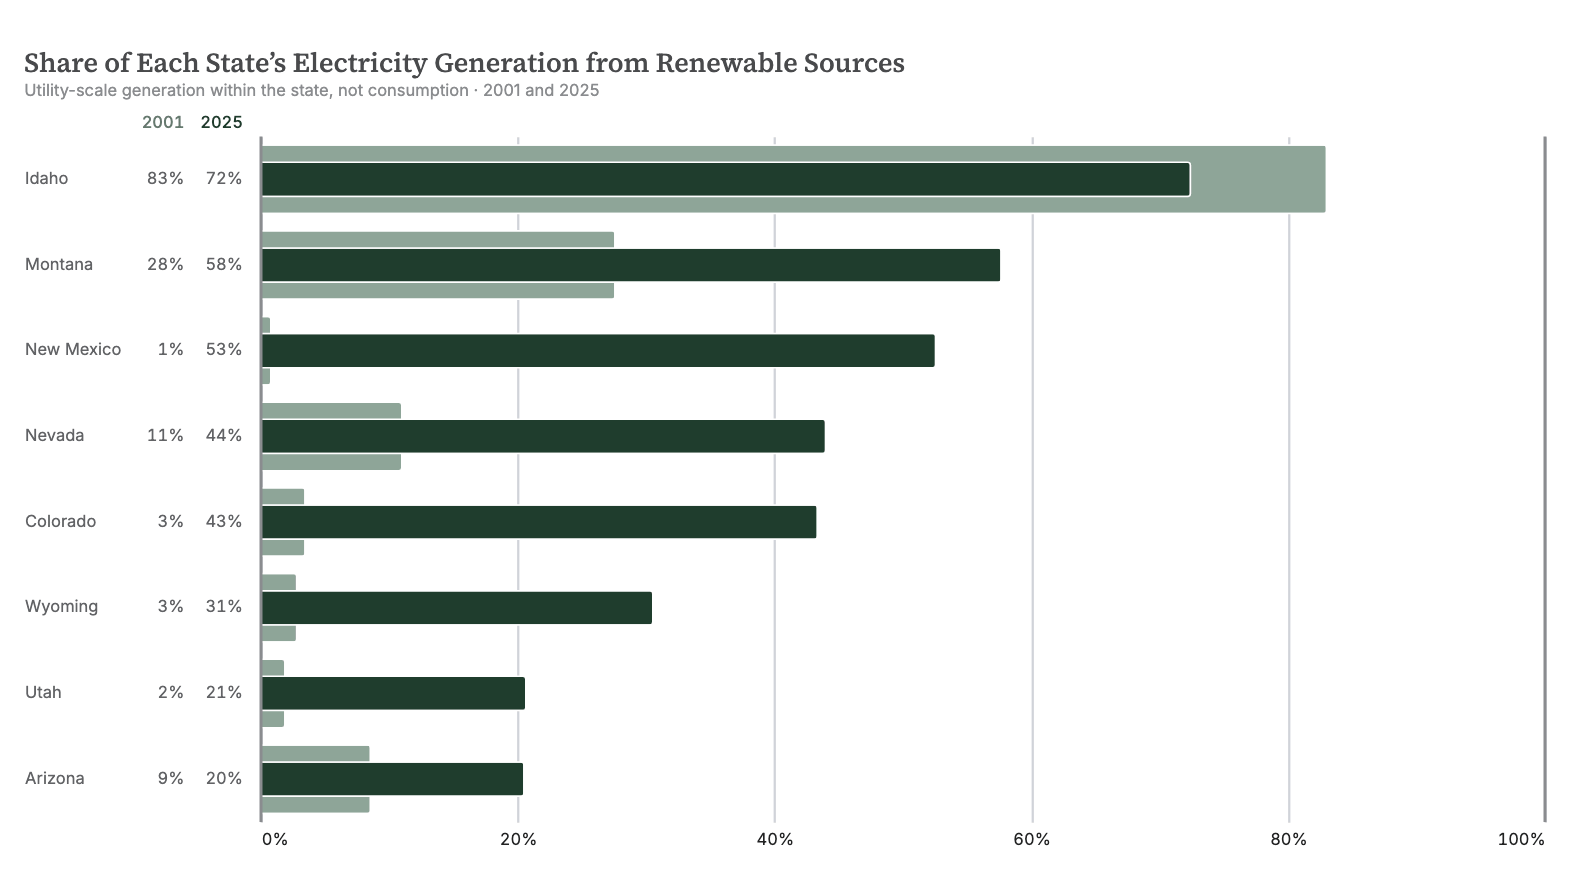
State names align left for easy scanning. Percentage values sit beside those names, supporting the corresponding bars. Colored year headings identify each series, without a separate legend. A heavy 100% rule reinforces the chart’s relative scale. The names, values, and bars share a coordinate system, so their alignment holds as sorting changes.
These details are system options and defaults. Here, a layer chart combines support_table with light and ink palette variants from our clarity theme.
Now consider how that electricity is generated. In Nevada, let’s spotlight solar’s rise. The line graph below puts the series names at the ends of their lines and follows fifteen years of monthly generation, so years label its axis. The column chart beneath it labels month and year, with the year only appearing where the calendar context changes. Line thickness responds to the density of points on screen. The partner donut chart carries direct labels and uses its center to display the total.
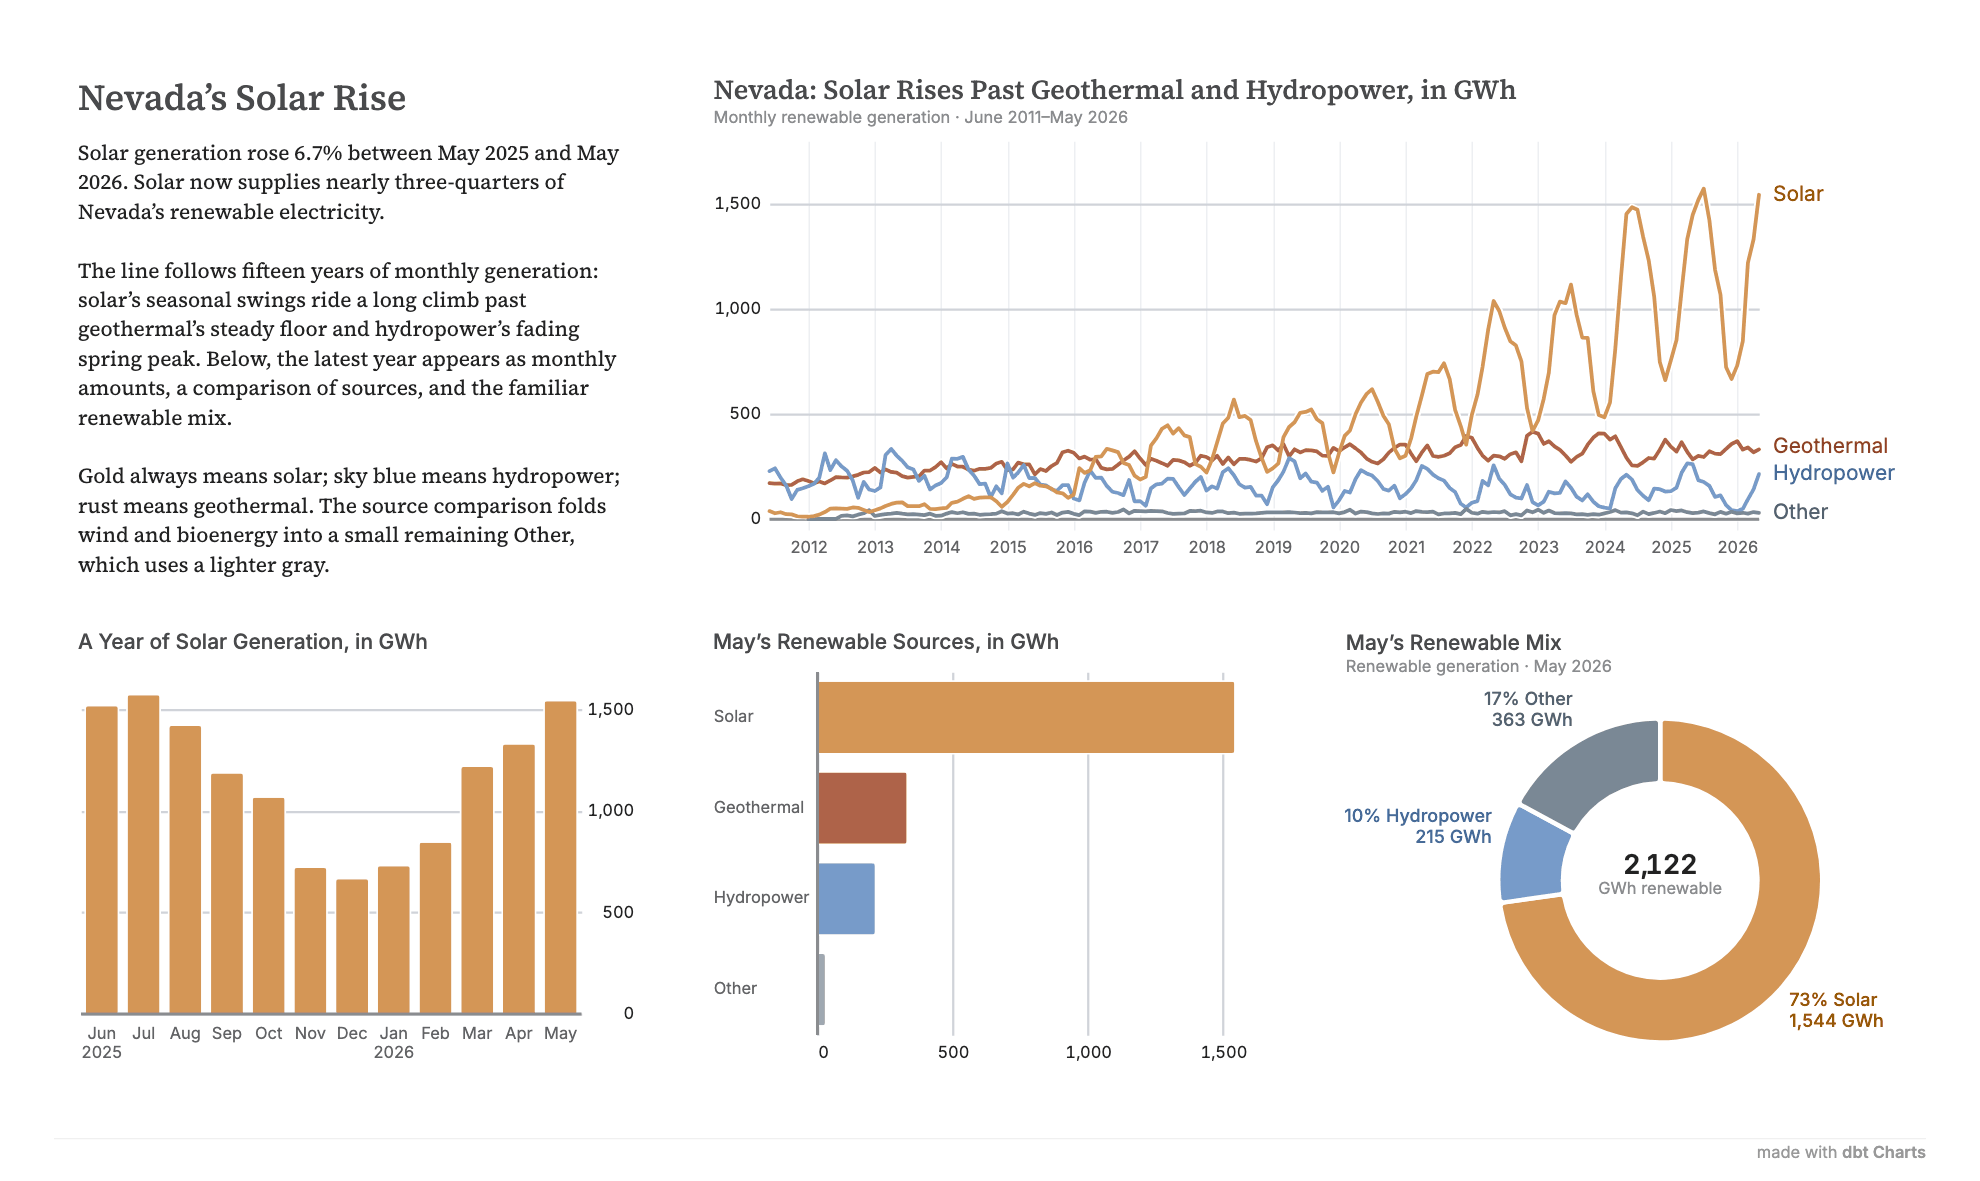
Solar is colored gold everywhere on this board because the board assigns colors to sources, keeping the line graph, source comparison, and donut consistent even if their categories appear in a different order. Darker companion inks keep labels legible: notice how solar’s label is a darker gold.
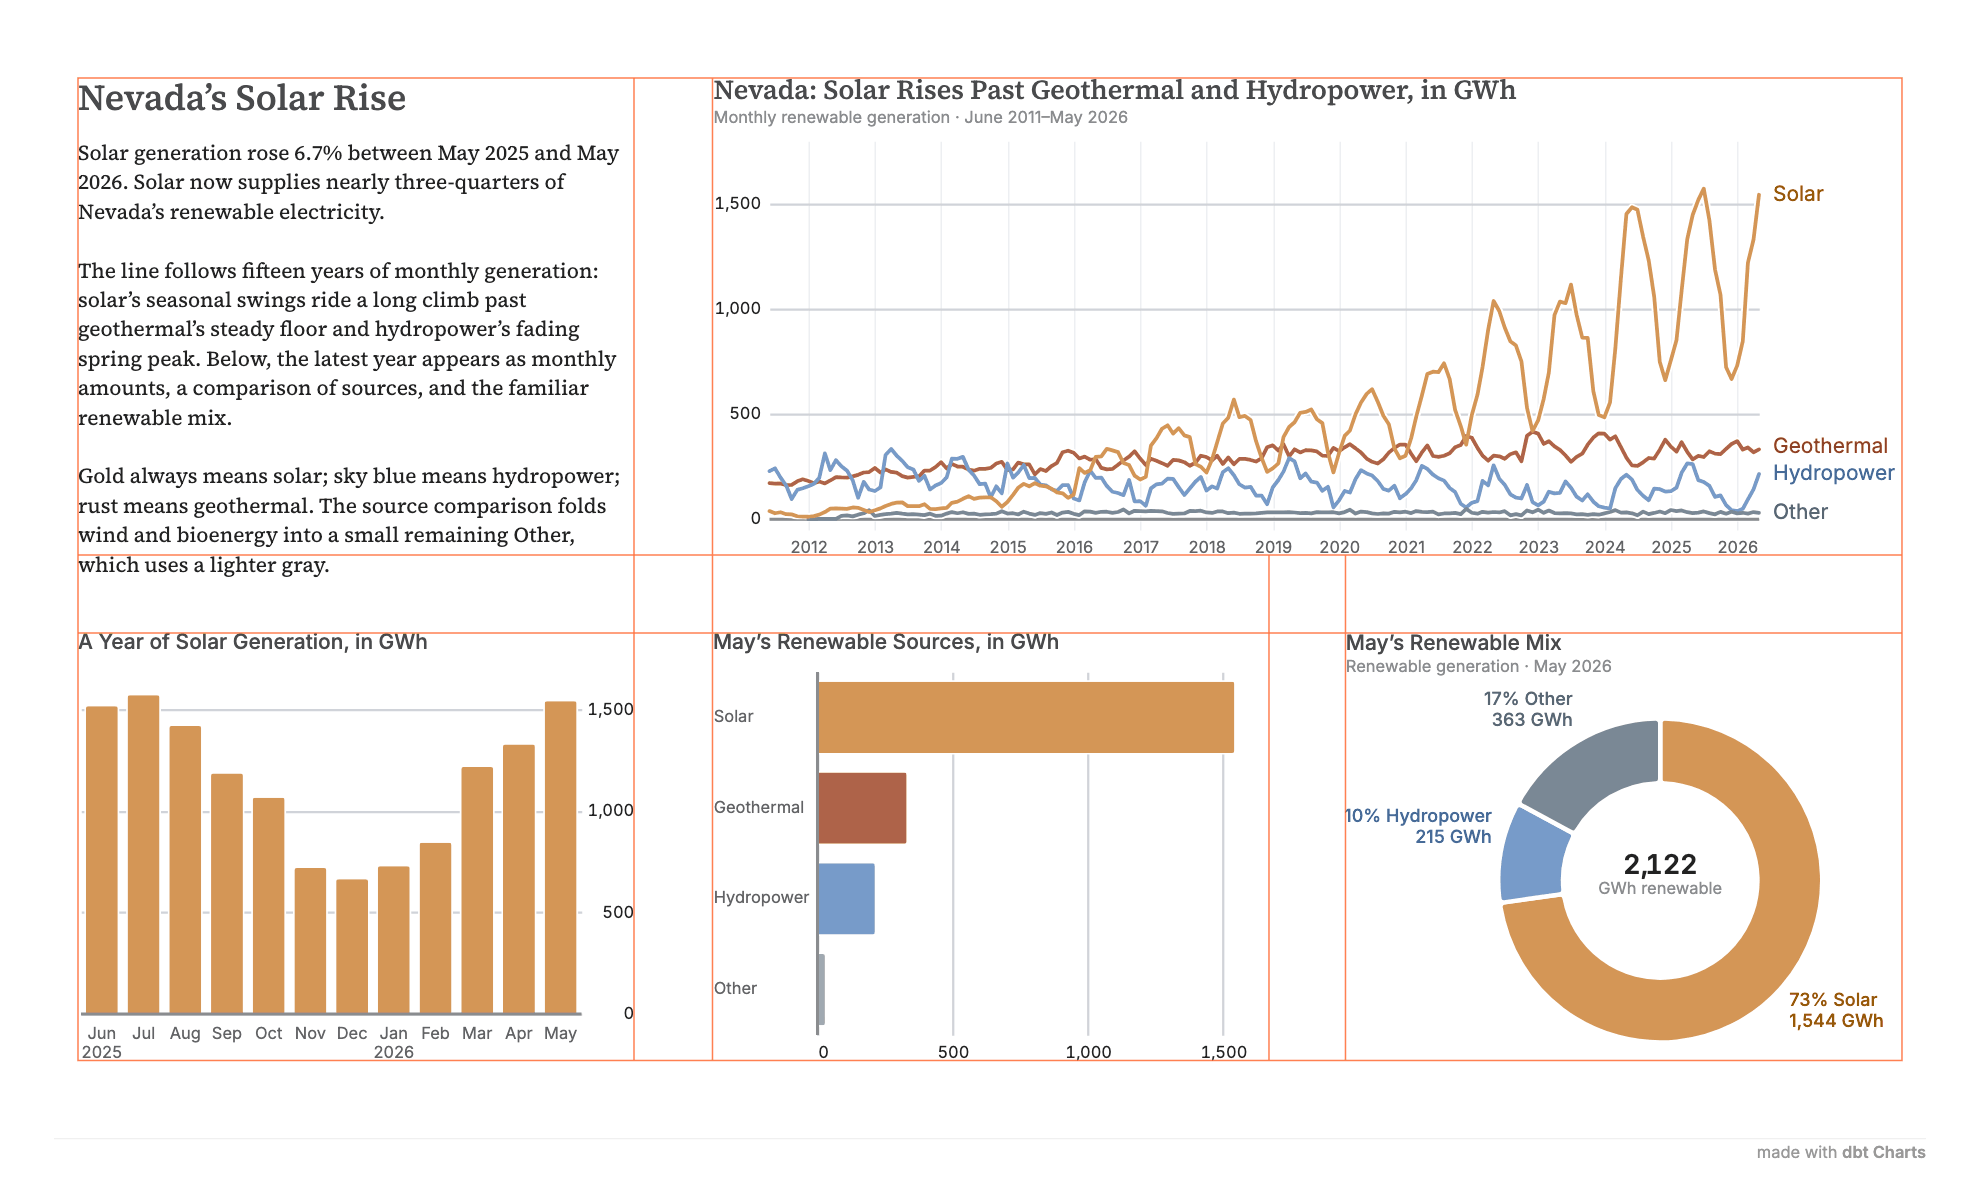
The orange guides below expose another shared decision: how those charts fit together. Prose and charts occupy one modular grid, with common spacing that aligns titles and plot areas. A wide chart can span columns while smaller charts share a row below it.
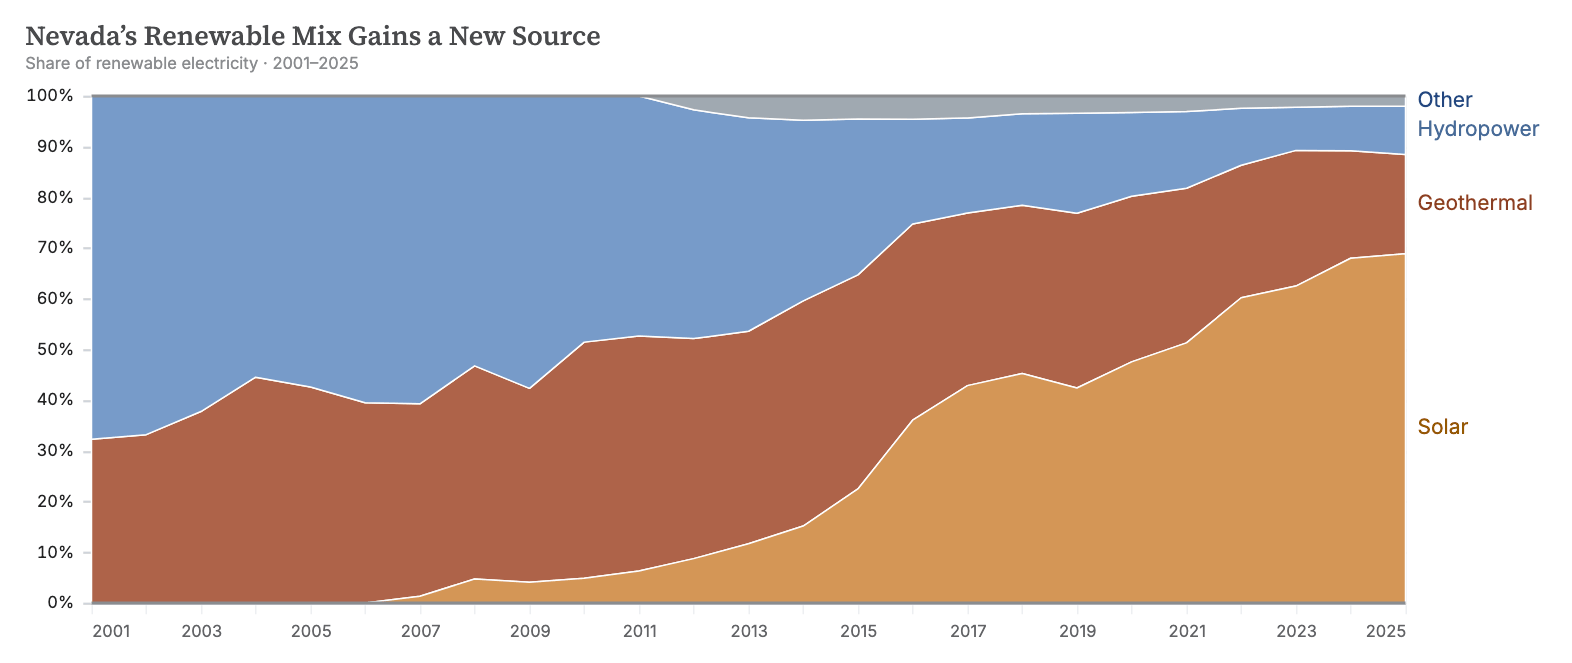
In the longer view below, solar’s gold band grows from nothing to more than two-thirds of Nevada’s renewable generation, while hydropower’s sky-blue band, most of the total in 2001, narrows. Zero and 100% remain firm landmarks, enclosing the same total height each year. The series names now center on the ends of areas instead of lines. The chart changes form and timespan while keeping the color and labeling conventions. Here, Other combines wind and bioenergy.
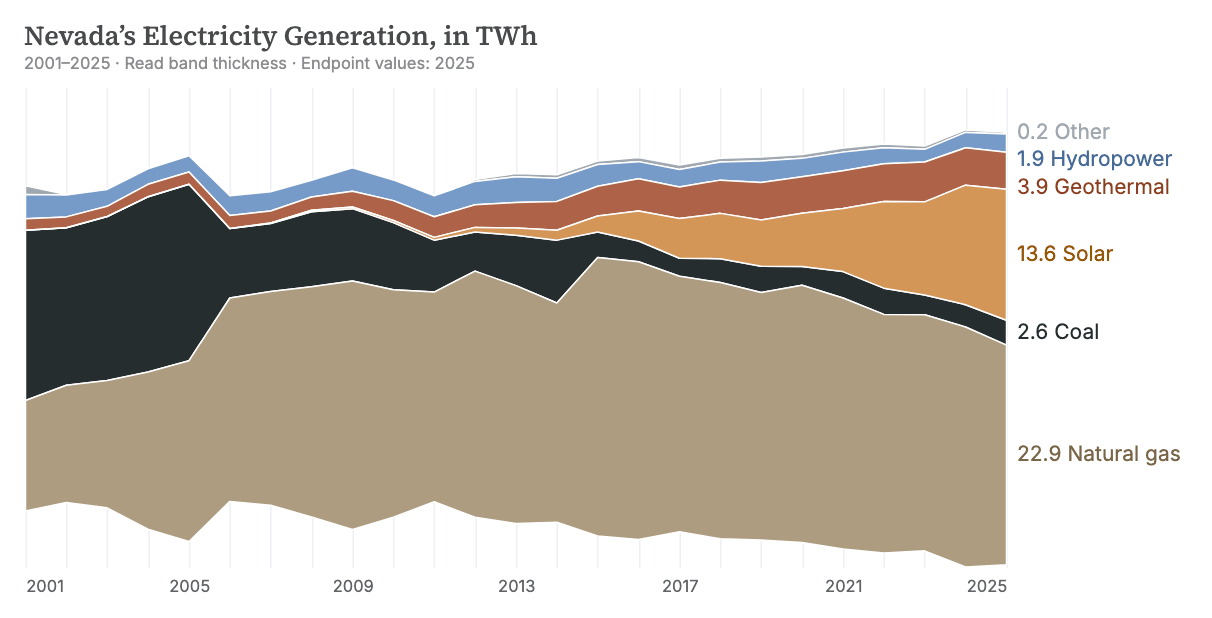
That renewable mix is only part of Nevada’s electricity supply. Add natural gas and coal, and the full system takes a different shape. The streamgraph below gives natural gas a brown band and coal the darkest charcoal while preserving our familiar colors. Together, the two charts let the reader follow solar’s promising rise in the context of total generation, as coal’s band thins toward nothing.
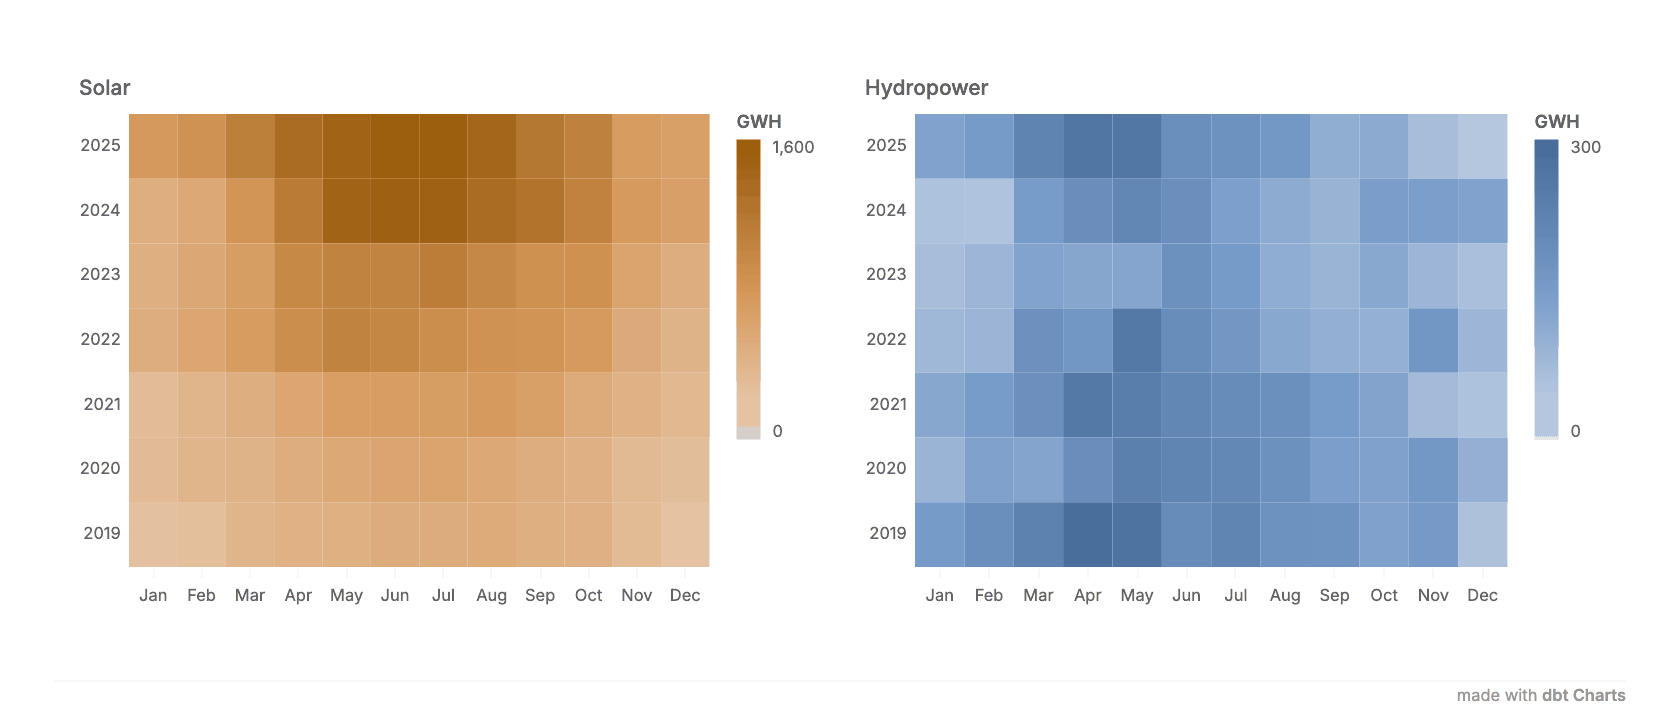
Arrange monthly values in a calendar and darker cells reveal two different stories: hydropower’s spring peak at Hoover Dam, fading as Lake Mead fell, and solar’s general rise. Each chart draws its intensity scale from the source’s assigned hue. The color keys show the fixed ranges used by the cells, 0–1,600 GWh for solar and 0–300 GWh for hydropower, keeping the year-to-year comparison consistent within each calendar. The most recent year sits at the top.
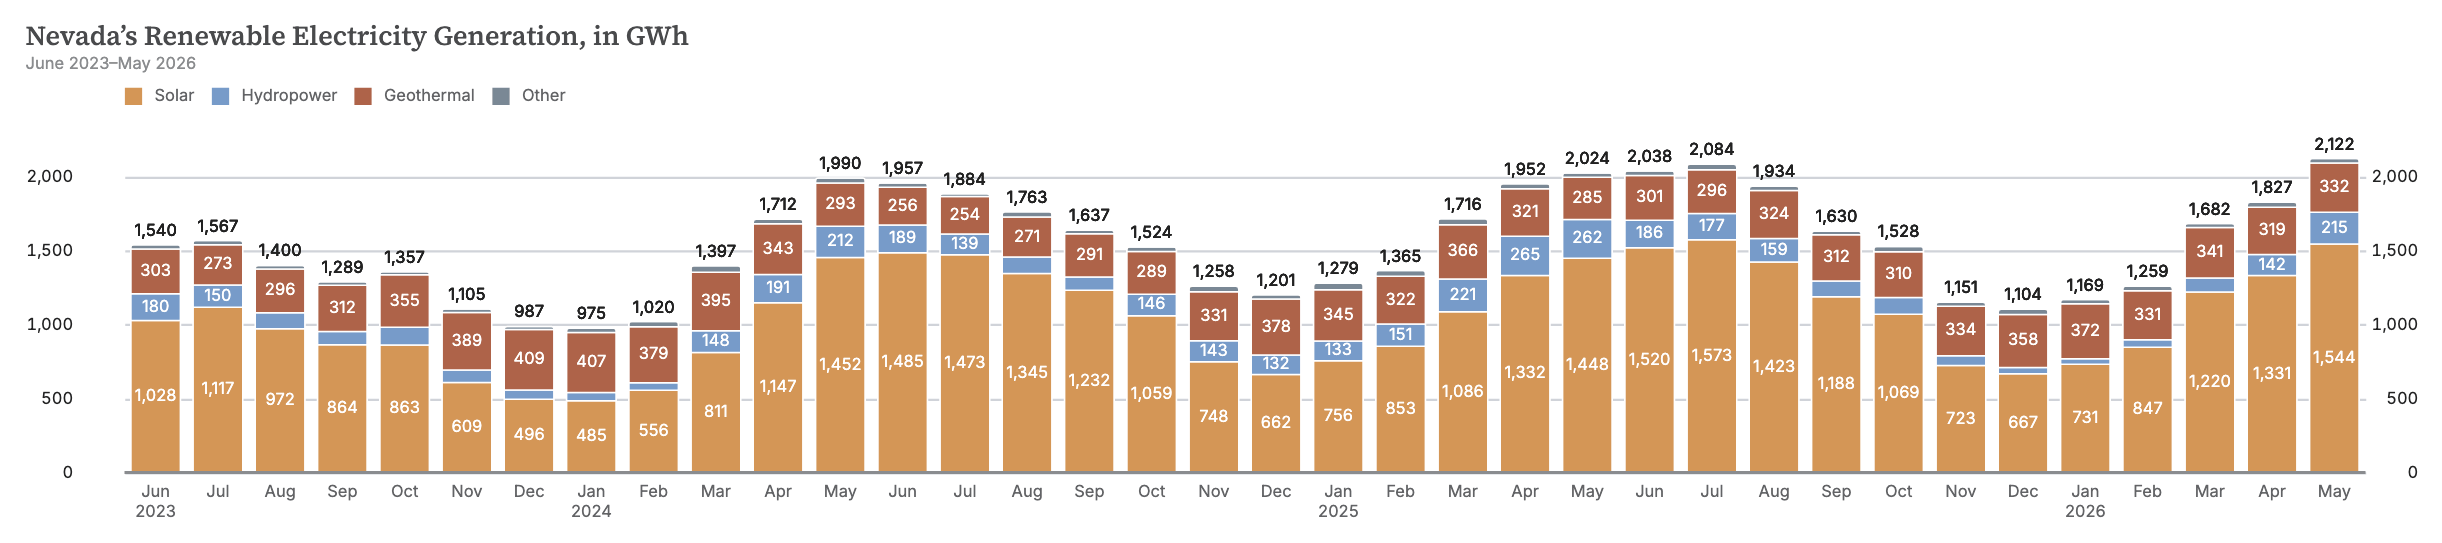
To read those seasonal changes as amounts, return to monthly columns. This time, individual value labels sit inside segments while the stack total lies outside. Across this particularly wide composition, duplicated vertical labels put a ruler beside both ends of the chart. Other combines wind and bioenergy.
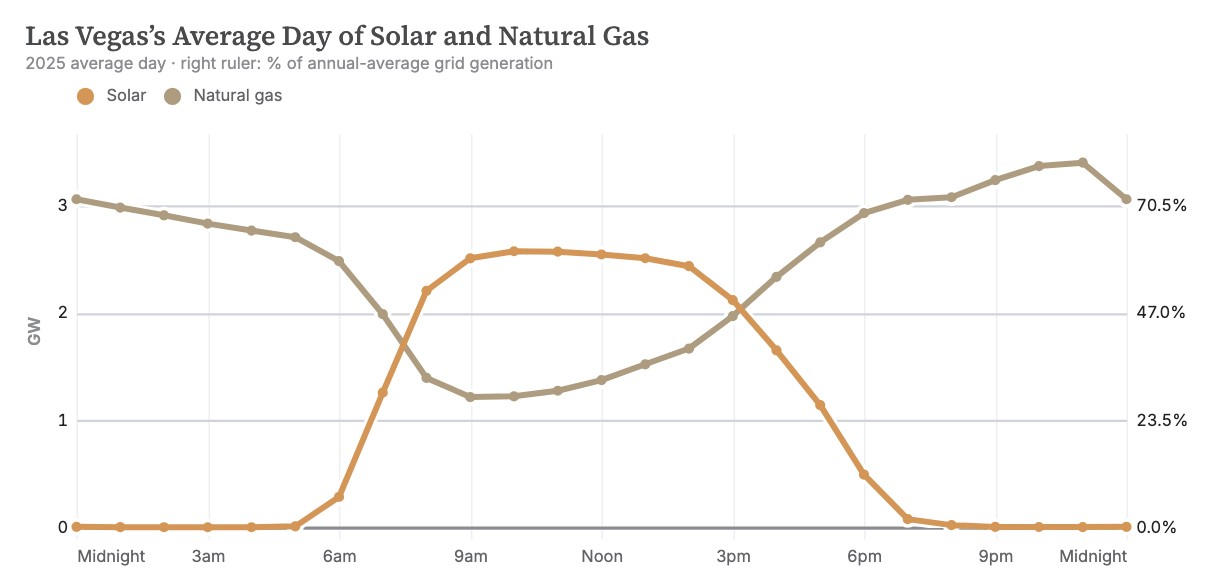
Let’s change our timescale again to see when power arrives across the day. Average a year of hourly observations from NV Energy’s grid, which serves Las Vegas, and solar’s daily curve appears centered at noon, with natural gas covering the night and the evening ramp. The axis uses words people recognize, Noon and Midnight, to mark time. The right ruler translates the left ruler’s GW ticks into percentages of annual-average grid generation: 1 GW meets 23.5%. One set of gridlines supports both readings.
These changes of view need explanation as well as consistent graphics. In the full board below, prose introduces regional renewable shares, connects them to Nevada’s generation, and defines the sources and measures. Each passage is authored as one block and flows into columns with measures chosen for readability. Text takes its place in the composition through the same system of spacing and alignment as the charts.
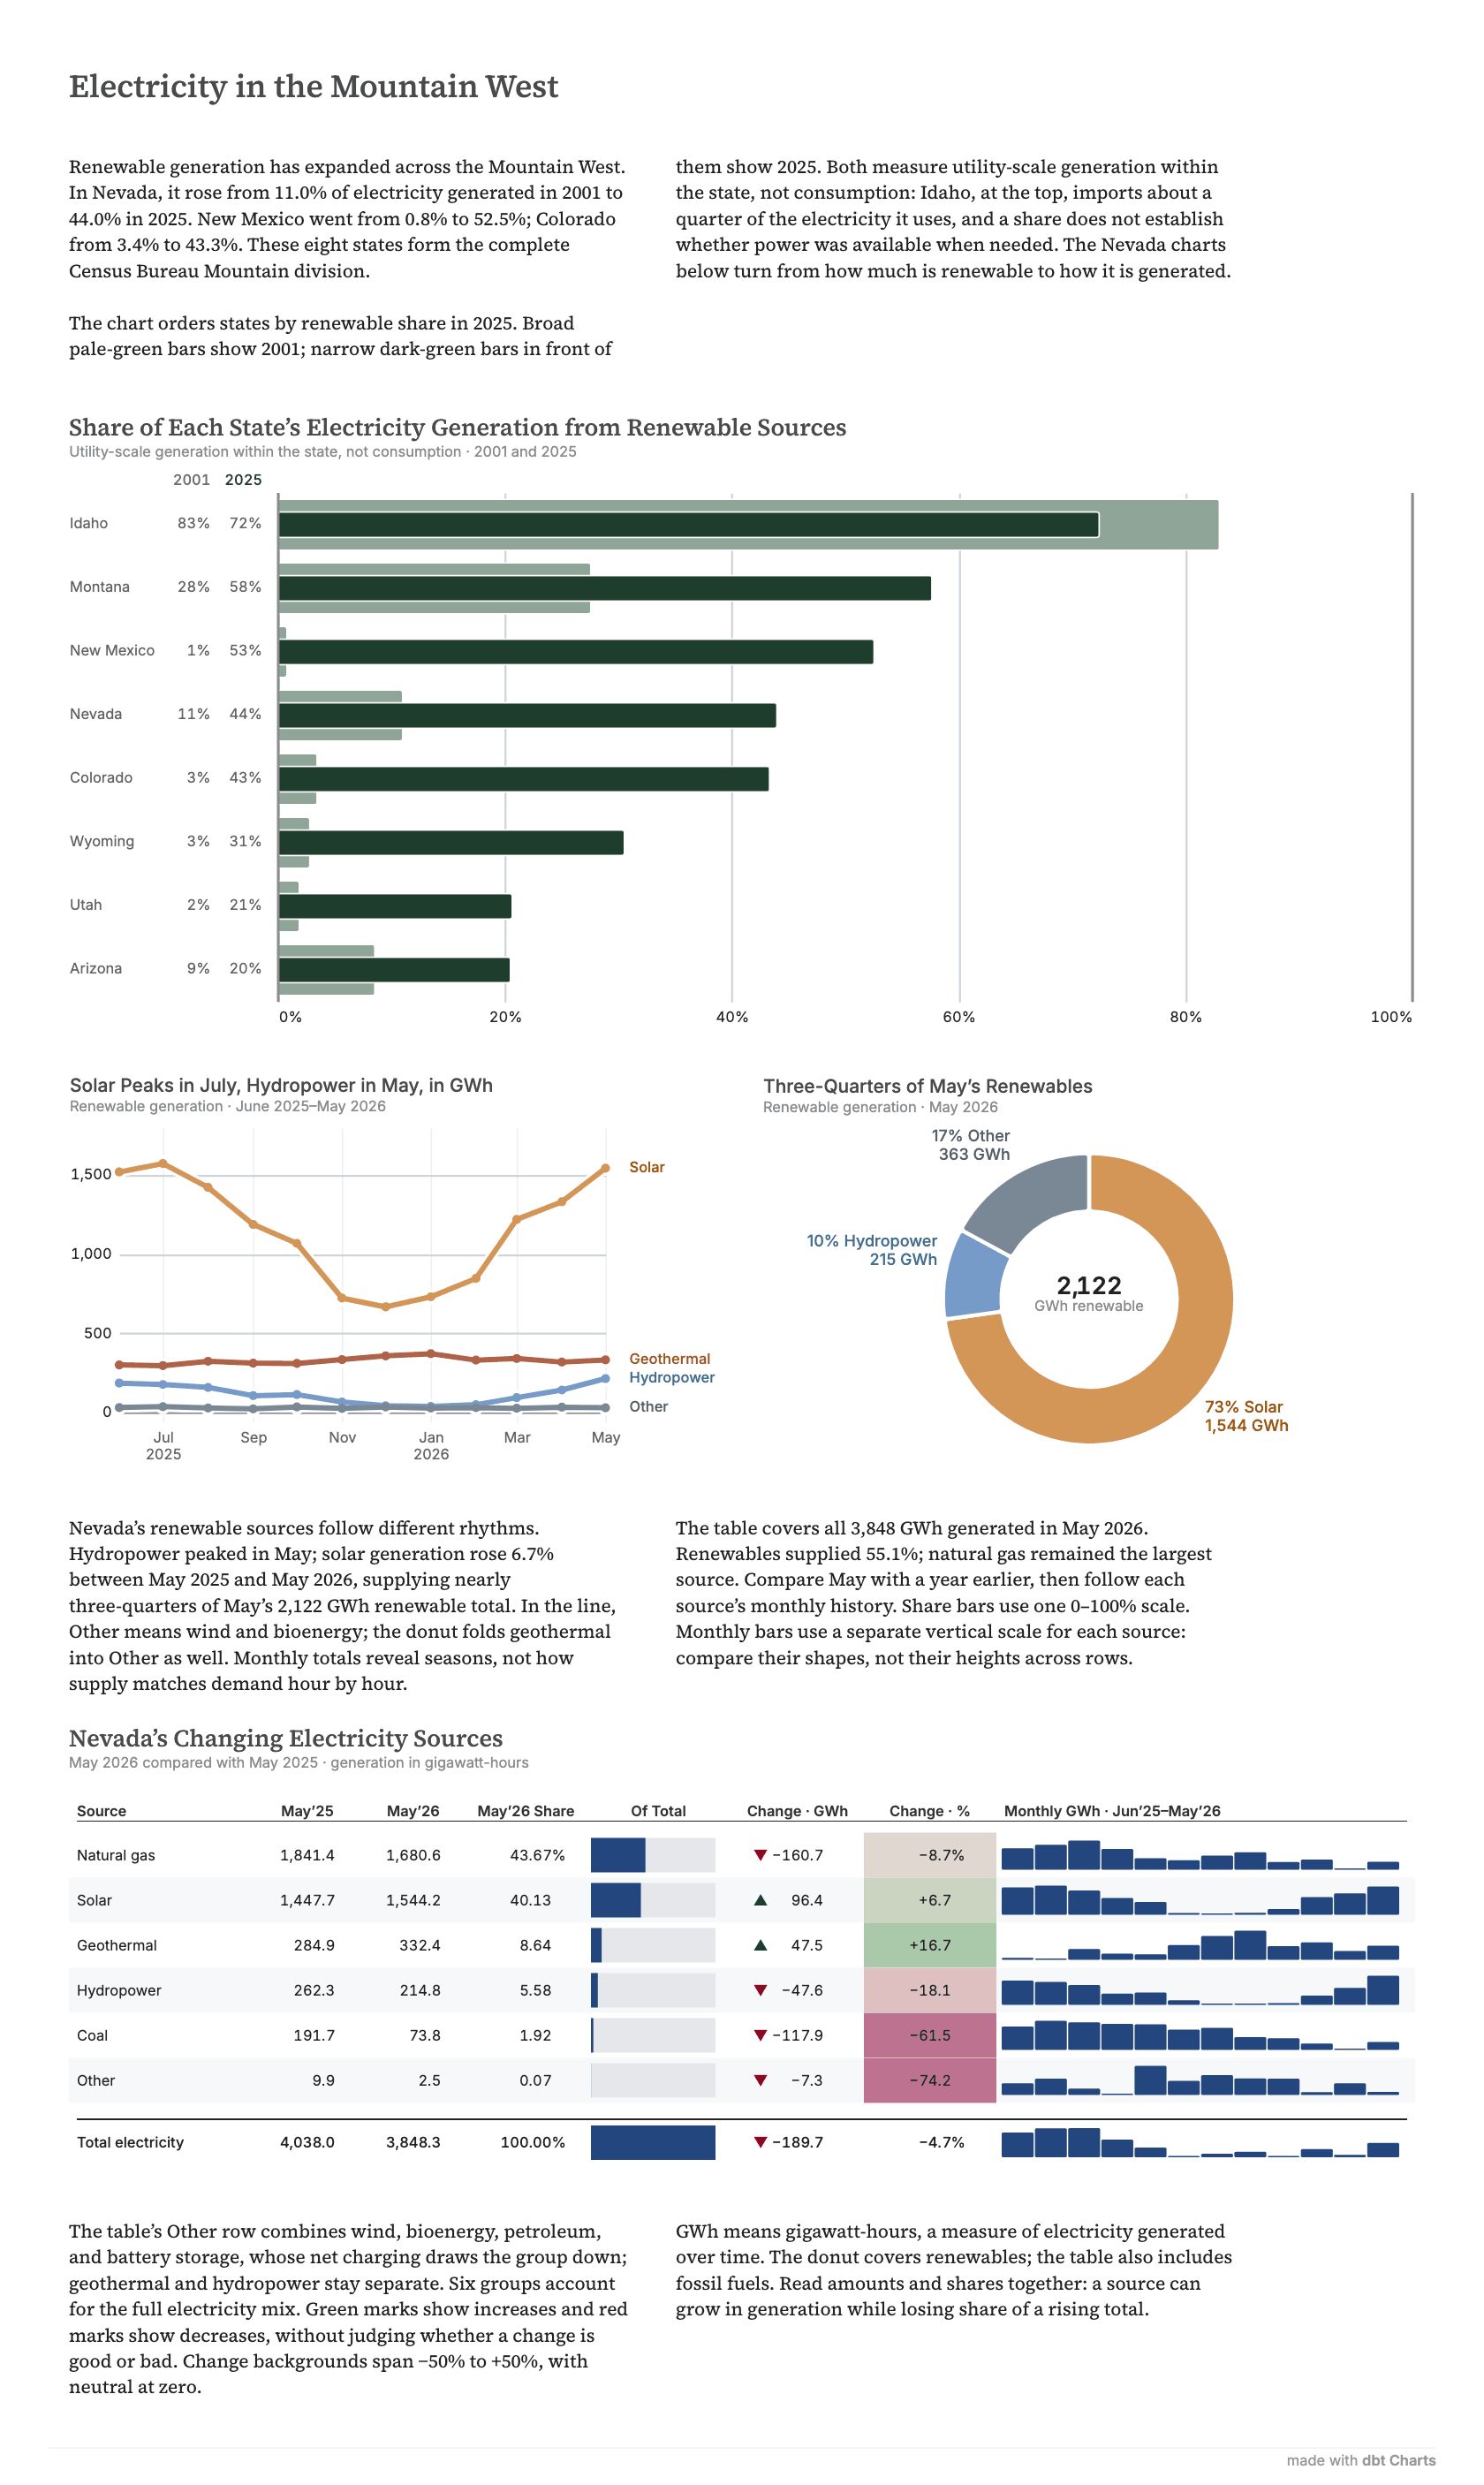
The bottom table extends that care to the accounting. Headers center over the numbers, which are arranged in decimal-aligned columns. A percentage column declares its unit in the first row, letting us focus our attention on the values, not the repeated suffix. Spark bars and background fills illustrate patterns alongside exact amounts; a distinct summary row makes the total easy to find.
A charting system should carry more of the repetitive design judgment that can be programmed: how months and years share an axis, how colors connect charts, how numbers line up for comparison. These details have often been treated as flourishes. We believe they should be in the defaults.
Data from the U.S. Energy Information Administration: state generation reported on Form EIA-923 (monthly and annual), and the Hourly Electric Grid Monitor (Form EIA-930) for NV Energy’s balancing authority, averaged for these charts. Utility-scale generation only; rooftop solar is not included.